The short answer, because that is what you came for.
Measured against followers, on Instagram: below roughly 1.3% is weak for a nano account (1K–10K), below 0.6% is weak in the mid tier, and below 0.7% is weak for a mega account. On TikTok, measured against views, below roughly 1.1% is weak and below 2.4% is below average.
Now the part that matters more than the number: those two sets of figures are not comparable, and most arguments about a “bad” engagement rate are actually arguments about which one is being used.
The same account, two honest engagement rates
Engagement rate is a fraction. Everyone agrees on roughly what goes on top — likes, comments, sometimes saves and shares. Almost nobody agrees on what goes underneath.
There are two denominators in common use:
- Followers. Interactions ÷ follower count. The older convention, still the default in most rate-card conversations and agency decks.
- Views. Interactions ÷ video views or impressions. The default for short-form video, and what the platforms themselves increasingly report.
They answer different questions. Followers asks “how much of this audience reacts?” Views asks “how much of the reach this content actually got turned into a reaction?”
The gap between them is not a rounding difference. On TikTok, where content routinely reaches far past the follower count, the same video can show an engagement rate three times higher on one denominator than the other. An account that looks poor by one measure looks healthy by the other — and both numbers are correct.
So before you judge a rate, ask which fraction produced it. If a creator’s media kit says 8% and your analytics say 2.5%, nobody is necessarily lying.
The numerator matters too
Less discussed, but real: whether shares and saves are counted at all. When we measured ad-labelled TikTok content in Turkey in September 2026, shares and saves together made up 20.7% of all engagement. A tool that counts only likes and comments reads that content roughly a fifth low — systematically, every time.
This is also why Instagram and TikTok should not be measured with one formula. On Instagram, sharing is a comparatively minor behaviour; on TikTok it is a primary one. We use a different formula per platform for exactly this reason.
Benchmarks against followers, by tier
Median engagement rates from a 2026 creator benchmark covering 3,125 active creators in fashion and beauty, measured over twelve months to August 2026. These are medians, not averages — one viral post doesn’t move them.
| Tier | TikTok | |
|---|---|---|
| Nano (under 10K) | 2.66% | 4.41% |
| Mid-tier (100K–500K) | 1.27% | 1.57% |
| Mega (1M+) | 1.49% | 1.44% |
A practical rule of thumb — ours, not a published standard: worry below about half the median for the tier, and treat anything above roughly 1.5× the median as genuinely strong. That puts the weak line near 1.3% for an Instagram nano account and near 0.6% in the mid tier, which is where the numbers at the top of this article come from.
Two things to notice in that table. First, the ladder is steep on the follower denominator — a nano account beats a mega account by two to three times, and that is normal, not a sign of quality. Comparing a 5K creator with a 2M creator on this number tells you almost nothing. Second, it does not fall cleanly all the way down: mega accounts often tick back up, because the audience at that scale skews toward fans rather than passive followers.
Brand-owned accounts sit far below all of these. Industry benchmark reports that sample company accounts rather than creators land around 2% at best and well under 1% on most platforms — which is the honest reason your own brand account’s engagement looks disappointing next to any creator you are considering.
Benchmarks against views
On the view denominator, something surprising happens: the tier ladder nearly flattens out.
A platform-wide analysis of 2 million TikTok videos across 214,507 profiles put every follower band between roughly 3.75% and 4.40% — a spread of 0.65 percentage points from the smallest accounts to the largest. The steep ladder you see on the follower denominator largely is the follower denominator; dividing by views neutralises account size, because reach is already in the number.
This is useful in practice: if you are comparing creators of very different sizes, the view denominator is the fairer basis.
Our own measurement: Turkish ad-labelled TikTok content
Published benchmarks are global and mostly English-language, so in September 2026 we measured a Turkish sample directly.
Setup: 258 TikTok videos carrying Turkey’s own advertising disclosure hashtag — that is, content whose creator declared it commercial — each at least seven days old so the view counter had settled. Giveaway posts were removed. Engagement counted as likes + comments + shares + saves, divided by views.
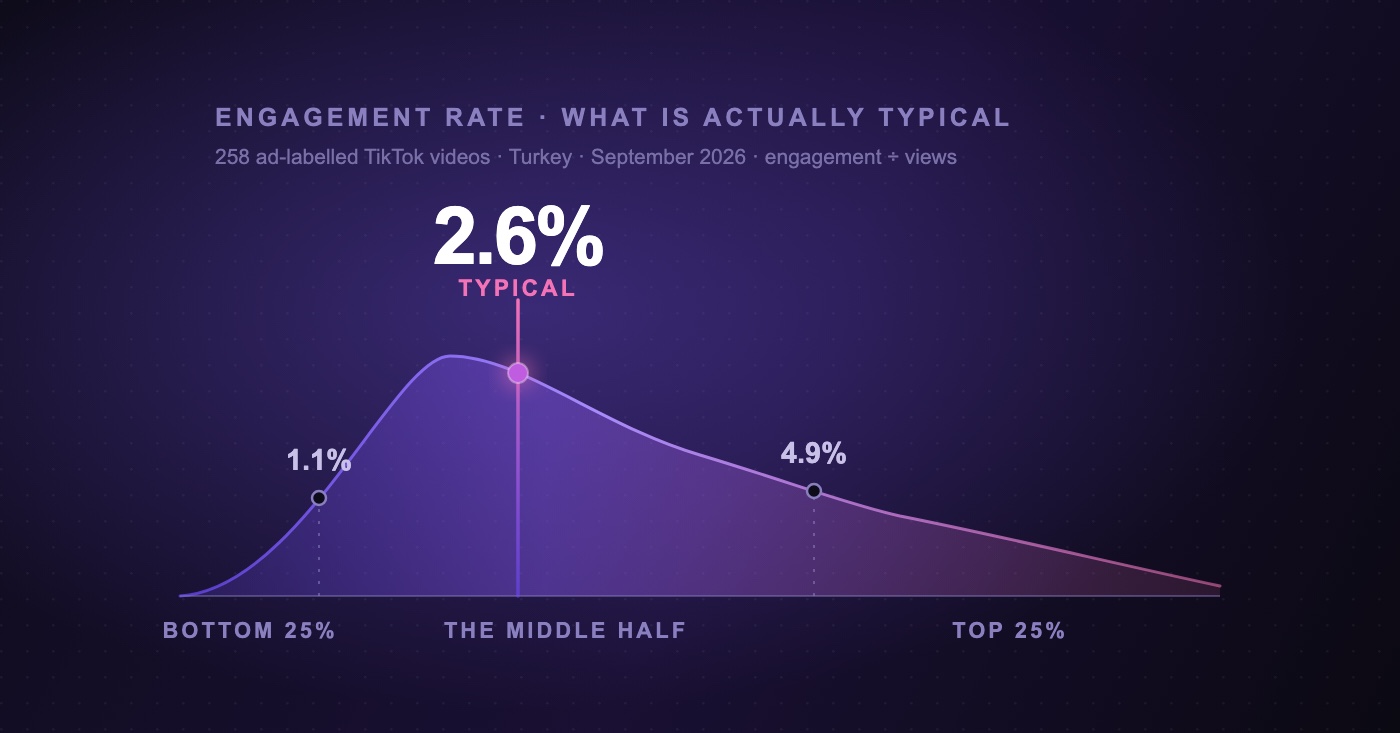
| Percentile | Engagement rate |
|---|---|
| p10 | 0.45% |
| p25 | 1.07% |
| Median | 2.60% |
| p75 | 4.88% |
| p90 | 7.21% |
So for sponsored TikTok content in this market: under about 1.1% is the bottom quarter, 2.6% is typical, and above 4.9% puts you in the top quarter.
The mean is 3.51% — noticeably higher than the 2.60% median, because the distribution has a long right tail. This is why averages mislead on engagement: a handful of runaway videos pull the average above what a typical post actually achieves. Most “average engagement rate” figures you will find quoted are means, and most of them describe a post that didn’t happen.
Limits, stated plainly: one disclosure hashtag, one country, commercial content only, a sample in the hundreds rather than the millions. It is a sharper instrument than a global average for this specific market, and a blunter one than the large platform-wide studies. We publish the method so you can judge which.
Three reasons a “bad” rate may not be bad
It is falling everywhere. Engagement rates dropped across every major platform over the past two years — TikTok’s follower-denominator figure fell roughly 20% in the first half of 2026 alone. A rate that looks worse than last year’s benchmark may simply be this year’s benchmark.
Category sets the floor. Published medians by industry span more than tenfold — health and beauty sit at the bottom on most platforms, education and community-led categories at the top. A 0.5% in one category and a 2% in another can be the same percentile.
Reach that overshoots the audience deflates it. A video pushed well beyond its follower base by the algorithm collects views from people with no relationship to the creator. Engagement rate falls — while the campaign does better, not worse. On the view denominator this is a real and common effect.
And one reason a good rate may not be good
Engagement rate counts reactions. It does not read them.
A thousand fire emojis and a thousand comments asking “does this work on oily skin?” produce an identical engagement rate. One of them is an audience enjoying a creator; the other is an audience considering a purchase. If you are paying for the second and measuring the first, the percentage tells you nothing about whether your money worked.
This is also the gap that bought engagement hides in. Inflated accounts buy the metric you are checking — that is the point of buying it. A high rate is a reason to look closer, not a reason to stop looking. We cover what to check in how to spot fake followers, and why scale and engagement trade off in micro vs. macro creators.
What to do with a low number
- Check the denominator before anything else. Half of all bad engagement rates are arithmetic, not performance.
- Compare within tier and category, never across. A mid-tier beauty creator is benchmarked against mid-tier beauty creators.
- Compare the creator against themselves. Their median across recent posts is a better baseline than any published table, because it holds audience, niche and format constant.
- Read the comments underneath the rate. That is where the answer to “is this 2.6% worth paying for?” actually lives.
That last step is what Vibemetri does: it evaluates the comments on a campaign with AI and shows you how much of the reaction was genuine interest, how much was community support for the creator, and how much was noise — alongside the rate itself, with the formula it used stated on the page. See how it works.
Summary
There is no single bad engagement rate, because there is no single engagement rate. Fix the denominator, then compare within tier and category, then find out what the reactions actually said. A 1.5% that is full of purchase questions beats a 6% of emoji every time — and only one of those two facts shows up in the percentage.
For the underlying mechanics of the metric, see what engagement rate actually tells you; for what it means for what you pay, see the influencer price list guide.
Benchmark figures are compiled from public industry research published in 2026 and vary by category, market and measurement method; they are indicative, not standards. The Turkish TikTok percentiles are our own measurement, with its sample and limits described above.